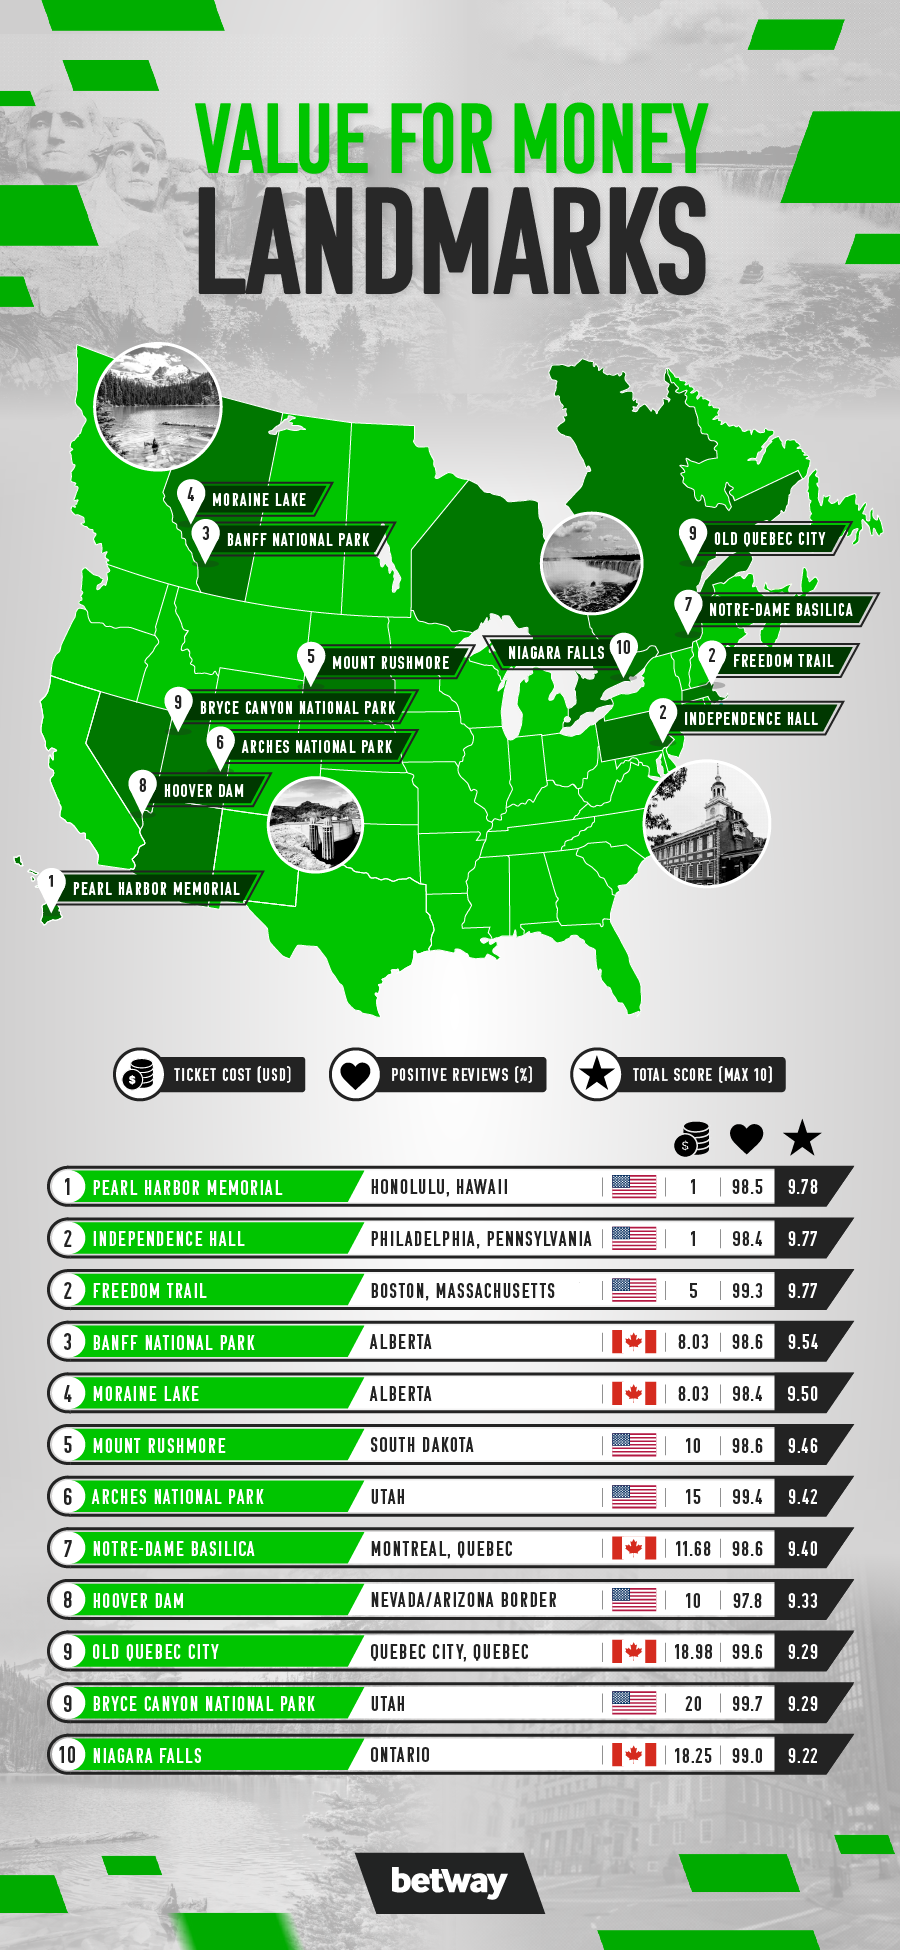
We analyzed 50 attractions in America and Canada to find out which ones offer the best value for money. Discover the best landmarks in North America, here.
North America is home to countless tourist attractions that all celebrate the continent’s history and scenery. But which landmark is the best value for money?
To answer this question, the online casino team at Betway conducted a study which considered both the cost of admission and the number of positive reviews for each landmark. Using this, we could determine which is the best bang for your buck.
The USS Arizona Memorial took the top spot as the best value for money landmark in North America. The memorial can be found at Pearl Harbor, in Honolulu, Hawaii, and admission costs just $1. With 98.5% of visitors giving the memorial a positive review, it offers an affordable and significant experience which has earned the landmark a total score of 9.78/10 on our ranking.
The top 10 landmarks can be seen below:
|
Rank |
Landmark/Theme Park |
Location |
Country |
Ticket Cost (USD) |
Positive Reviews (%) |
Total Score (Max 10) |
|
1 |
Pearl Harbor Memorial (USS Arizona Memorial) |
Honolulu, Hawaii |
USA |
1 |
98.5 |
9.78 |
|
2 |
Independence Hall (Museum Tours) |
Philadelphia, Pennsylvania |
USA |
1 |
98.4 |
9.77 |
|
2 |
Freedom Trail (Old North Church) |
Boston, Massachusetts |
USA |
5 |
99.3 |
9.77 |
|
3 |
Banff National Park (Park Pass) |
Alberta |
Canada |
8.03 |
98.6 |
9.54 |
|
4 |
Moraine Lake (Parks Admission Required) |
Alberta |
Canada |
8.03 |
98.4 |
9.50 |
|
5 |
Mount Rushmore (Parking Fee) |
South Dakota |
USA |
10 |
98.6 |
9.46 |
|
6 |
Arches National Park (Entrance Fee) |
Utah |
USA |
15 |
99.4 |
9.42 |
|
7 |
Notre-Dame Basilica |
Montreal, Quebec |
Canada |
11.68 |
98.6 |
9.40 |
|
8 |
Hoover Dam |
Nevada/Arizona Border |
USA |
10 |
97.8 |
9.33 |
|
9 |
Old Quebec City (Museums) |
Quebec City, Quebec |
Canada |
18.98 |
99.6 |
9.29 |
|
9 |
Bryce Canyon National Park (Entrance Fee) |
Utah |
USA |
20 |
99.7 |
9.29 |
|
10 |
Niagara Falls (Journey Behind the Falls) |
Ontario |
Canada |
18.25 |
99.0 |
9.22 |
Coming in at a very close second is the Independence Hall. Located in Philadelphia, visitors only have to pay $1 to see where both the Declaration of Independence and the U.S. Constitution were signed. An impressive 98.4% of visitors have given this historical site a positive review, which has led to it receiving a total score of 9.77/10 on our list.
Joint for second place is the Old North Church in Boston. For those who want to learn the history of the American Revolution, admission does cost slightly more than the previous two landmarks on our list – $5. However, the landmark has received a positive review from a staggering 99.3% of visitors. This has led to its high position on our ranking with a total score of 9.77/10.
Coming third on the list is Banff National Park, Canada’s oldest national park. While this destination will cost visitors $8.03 for a pass, 98.6% of visitors have rated it positively. With a total score of 9.54/10, it’s a value choice if you’re visiting Canada.
Rounding out the top 5 on our ranking is Moraine Lake, which secures fourth place with a total score of 9.54/10, followed by Mount Rushmore in fifth place, with a score of 9.50/10.
Of the 45 landmarks studied, there were plenty of options for those seeking an affordable experience. The average cost for the landmarks was $31.99. However, attractions in the USA did come out at a lower price overall. Tourists visiting the States can expect to pay an average of $25.79 for admission, while those looking for a day out in Canada will have to pay an average of $34.20 per ticket.
The landmarks studied were also well received, with an average of 96.0% positive reviews from visitors. Attractions in the USA were viewed more favorably, with 96.9% of visitors giving a positive review, while 93.8% of visitors enjoyed the Canadian attractions.

Methodology
This dataset ranks 45 attractions, based on how good they are for value for money. To do this, 2 different factors were used. Once the data for the factors was collected, the factors were then normalized, to provide each factor with a score between 0 and 1. If data was not available, a score of 0 was given. The normalized values were then summed and multiplied by 5, to give each attraction a total score out of 10. The attractions were then ranked from highest to lowest, based on their total scores.
The factors used are as follows:
· Ticket Cost – The cost of a ticket at each attraction, if the attraction is free then the price of an extra is used, data gathered from the websites of each attraction.
· Positive Reviews – The percentage of ‘average’, ‘very good’ & ‘excellent’ reviews on TripAdvisor, for each attraction.
The factors were indexed as follows:
· Ticket Cost – Low values get a high score. High values get a low score.
· Positive Reviews – High values get a high score. Low values get a low score.
All data is correct as of 11/10/24. The ranking data shown is a compilation of multiple data sources and may not be representative of real life. All data is accurate with regards to the sources provided. Exchange rate of 1 USD – 1.38 CAD was used for ticket price conversion.

